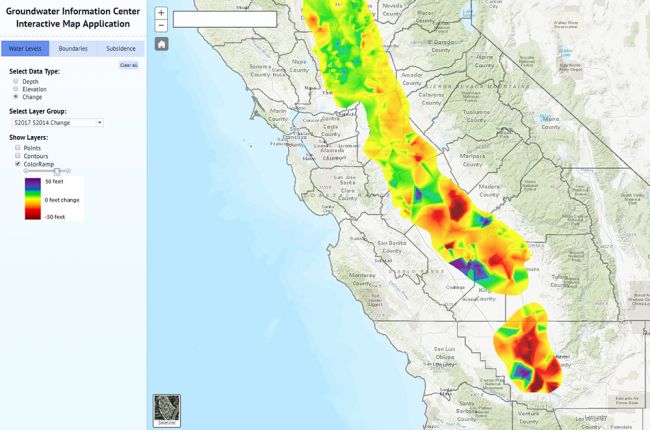
The California Department of Water Resources has created an interactive map that shows geospatially referenced groundwater levels, groundwater table elevation, and subsidence in California.
The map includes:
Other layers show which regions are encompassed by groundwater management plans, groundwater models, and county boundaries. Users can choose how to visualize water levels (points, contours, or a color ramp), whether to include legislative boundaries, and can download the data for further use and analysis.
Click here to access the interactive map.