February 2, 2024—This update compares flu vaccination coverage across several indicators to the same time last season as well as prior to the COVID-19 pandemic when available.
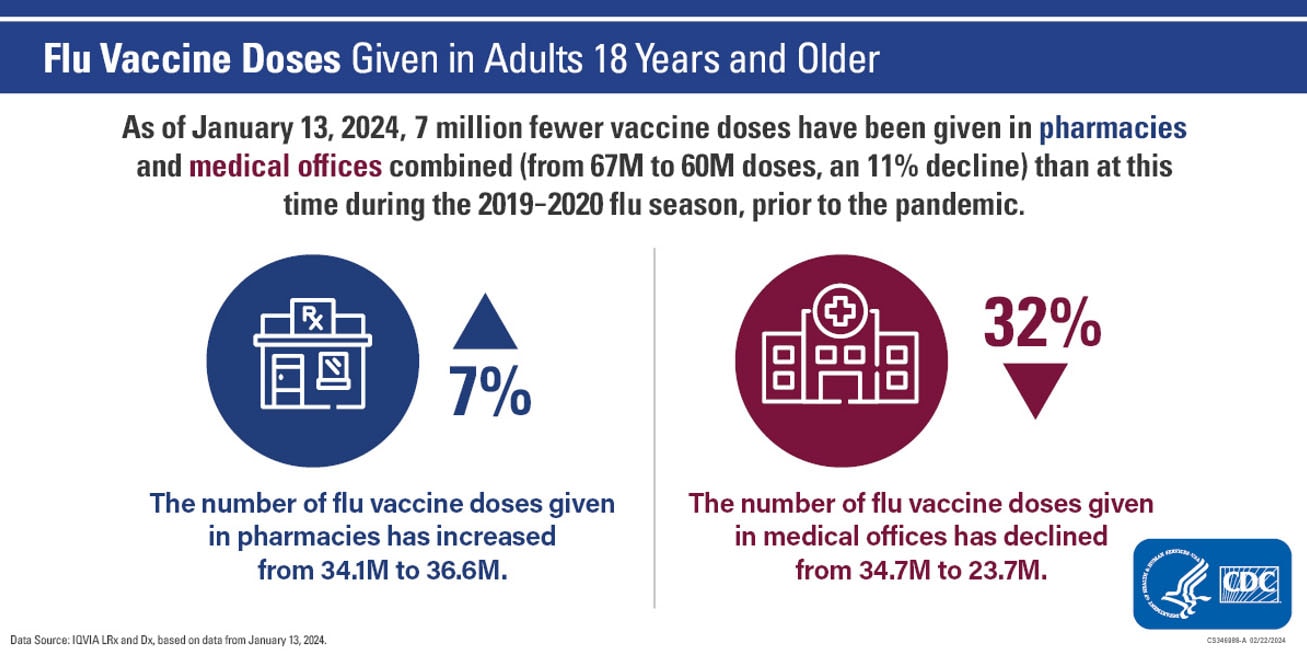
According to insurance claims data for adults 18 years and older, as of January 13, 2024, the number of flu vaccination doses given so far this season in pharmacies and medical offices is lower compared with last season by about 7 million doses (from 67 million to 60 million doses, or about an 11 percent decline). There were drops in the number of doses given in both pharmacies and medical offices this season compared with last season.
Since the COVID-19 pandemic, there has been an overall increase in the numbers of doses of flu vaccine given in pharmacies, while there has been an overall decrease in the number of flu vaccine doses given in provider offices.
More information is available from FluVaxView’s Weekly Flu Vaccination Dashboard (Figure 7, when sorted by place of vaccination).
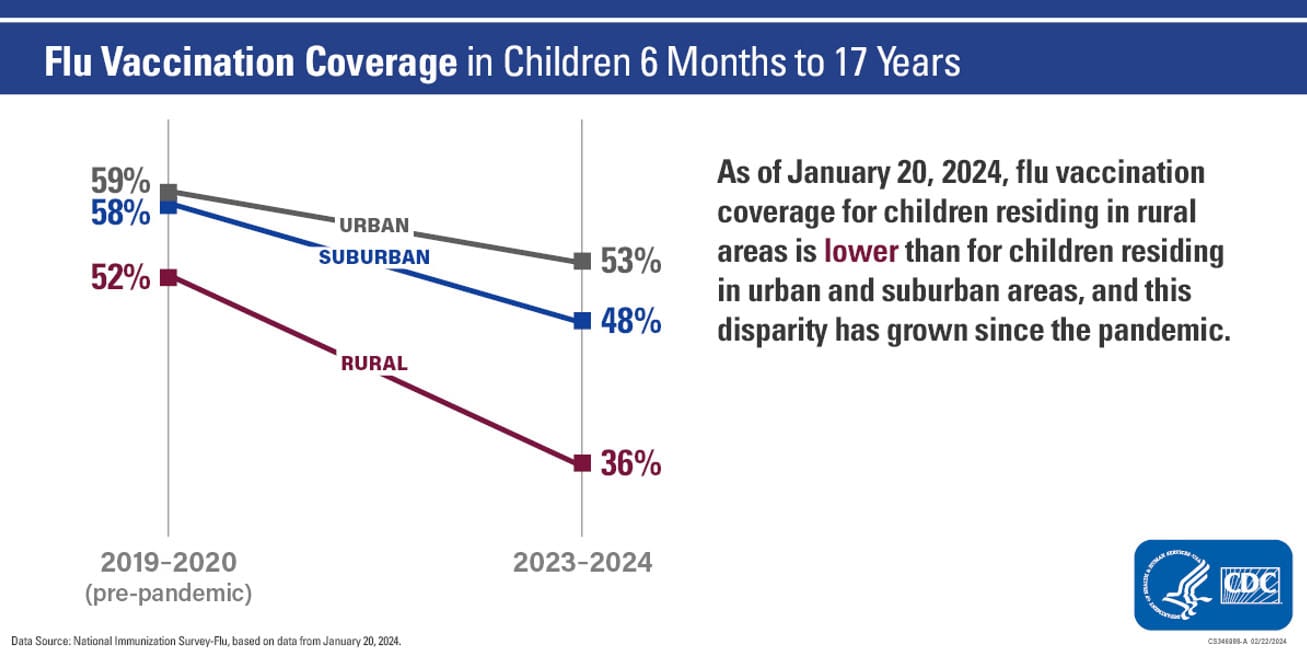
Disparities in vaccine uptake are sustained or worsening among people living in rural areas compared with those living in suburban or urban areas.
For children, as of January 20, 2024, flu vaccine coverage among children residing in rural areas was about 17 percentage points lower compared with children living in urban areas (36% compared with 52%) and about 12 percentage points lower compared with children living in suburban areas (36% compared with 48%).
Compared with the same time last season, coverage among children living in rural, suburban or urban areas has changed as follows:
Since the COVID-19 pandemic, coverage by urbanicity among children has declined as follows:
More information is available from FluVaxView’s Weekly Flu Vaccination Dashboard (Figure 2D, when sorted by urbanicity under the demographics tab).
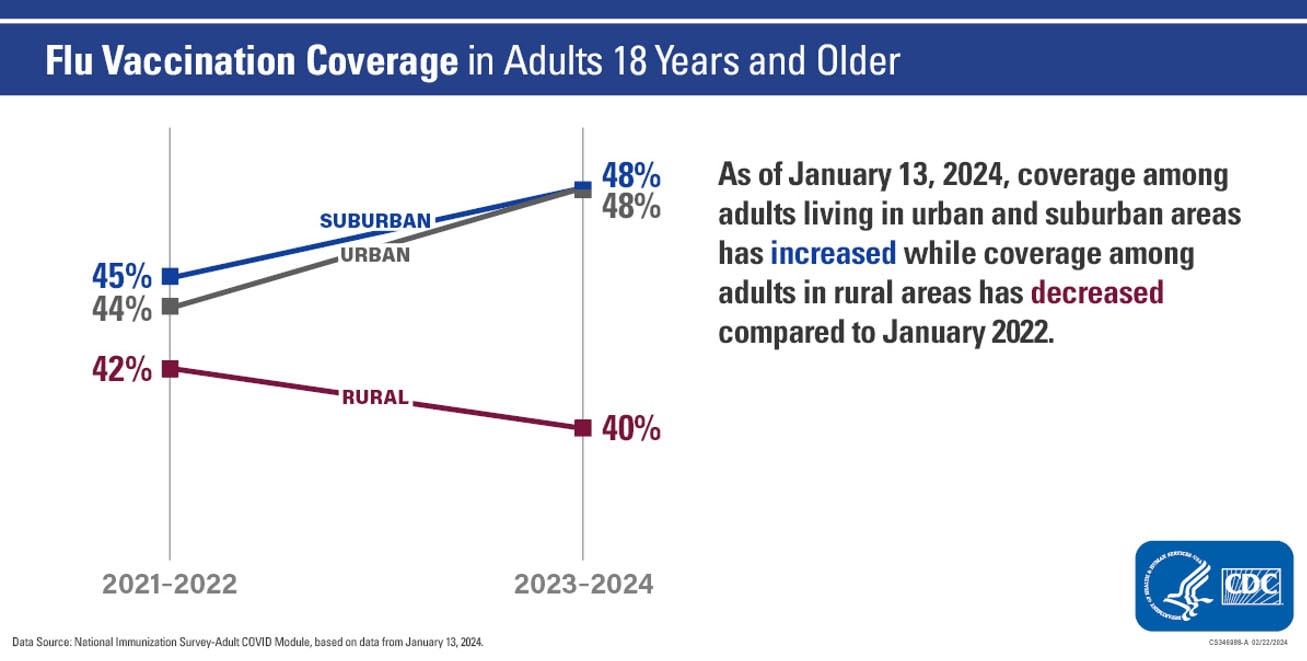
For adults, those living in rural areas also have lower flu vaccination coverage compared with adults living in urban and suburban areas. Flu vaccination coverage among adults living in rural areas is 8 percentage points lower compared with adults living in both urban and suburban areas (40% compared with 48% for both).
This disparity in vaccine coverage based on urbanicity has been observed for several years and is widening. Data for coverage among adults by urbanicity is available since 2021-2022. Since 2021-2022, vaccination coverage by urbanicity among adults has changed as follows:
CDC has collected survey data [5.3 MB, 27 pages] that show rural adults are more likely to report that they do not need a flu vaccine, do not think flu vaccination is effective, and are not worried about flu disease.
More information is available from FluVaxView’s Weekly Flu Vaccination Dashboard (Figure 4C, when sorted by urbanicity for the week ending 1/13/2024).
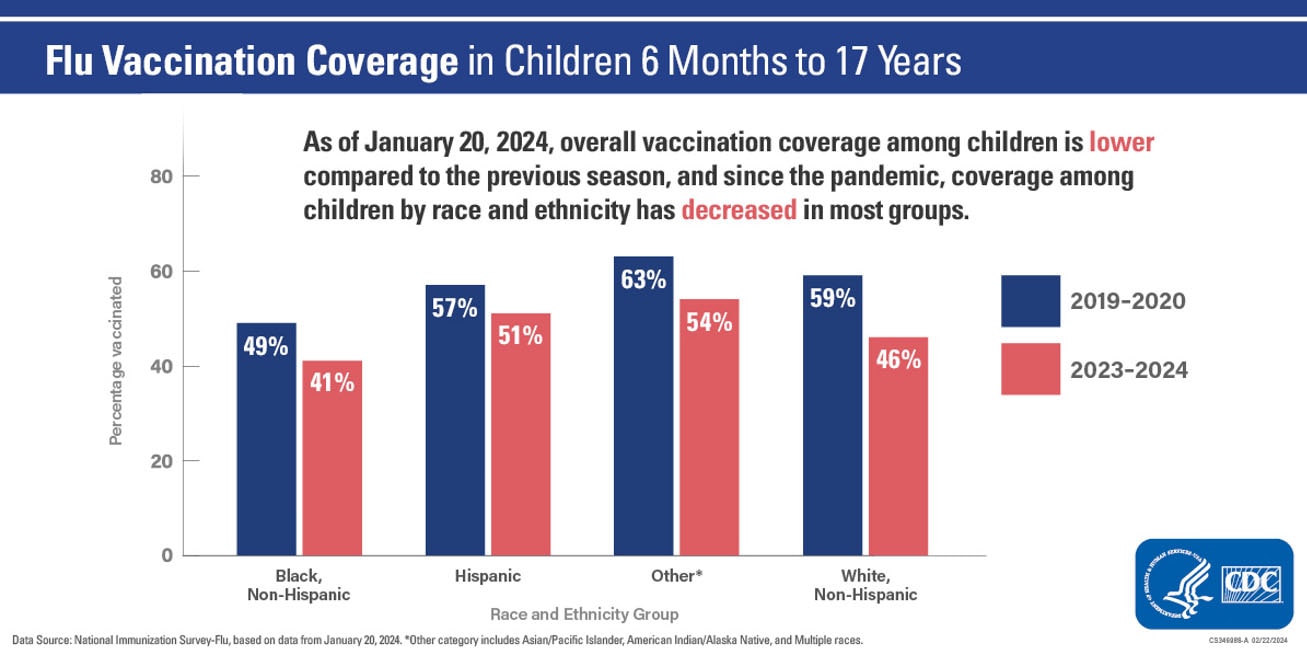
There have been improvements in vaccination coverage among Black and Hispanic adults compared with last season as of mid-January 2024. However, disparities by race and ethnicity persist and Black children and adults continue to have the lowest vaccine coverage compared with all other race/ethnicity groups.
For children, overall vaccination coverage for children was estimated to be 47.8% as of January 20, 2024, which is 3.5 percentage points lower compared with the same time last season (51.3%). The following declines in vaccination uptake this season compared with last were reported among children by race and ethnicity:
Hispanic children had similar coverage (50.9%) so far this season compared with last season. Coverage among children whose ethnicity is reported as “Other” (which includes Asian/Pacific Islander, Native American/Alaska Native, and two more race populations) was 53.6% and remained similar to last season. Black children have lower coverage (41.4%) than all other race/ethnicity groups.
Since the COVID-19 pandemic, coverage among children by race and ethnicity has remained similar, with the exception of among White, non-Hispanic children, and among children whose ethnicity is reported as Other:
More information is available from FluVaxView’s Weekly Flu Vaccination Dashboard (Figure 2D, when sorted by race/ethnicity under the demographics tab).
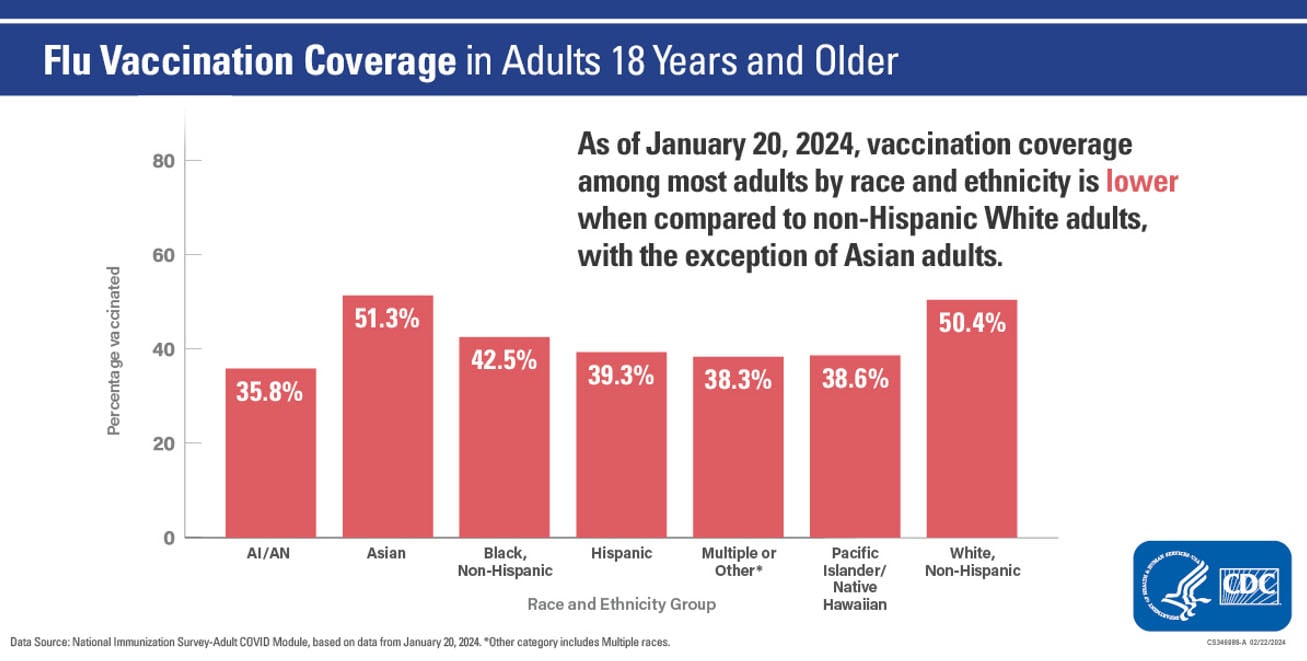
For adults, overall vaccination coverage was 47% as of January 20, 2024. Vaccination coverage among most adults by race and ethnicity is lower when compared with adults who are White, non-Hispanic. Of note, Asian, non-Hispanic adults are an exception and have similar vaccination coverage compared to White, non-Hispanic adults. Data from this season indicate the following vaccination coverage disparities among adults by race and ethnicity group when compared to White, non-Hispanic adults:
Note: Data for adults by race and ethnicity prior to the COVID-19 pandemic are not available. More coverage information on adults by race and ethnicity is available from FluVaxView’s Weekly Flu Vaccination Dashboard (Figure 4C, when sorted by race/ethnicity under the demographics tab).
New this season, CDC is now reporting flu vaccination coverage estimates based on Immunization Information Systems (IIS) data submitted to CDC from 47 jurisdictions monthly by age group. For most jurisdictions, flu vaccination coverage so far this season is within 5 percentage points of what these jurisdictions reported for children and adults at the same time last season (December 2022). More information is available at Weekly Flu Vaccination Dashboard | FluVaxView in the section titled “Jurisdiction Vaccine Administration and Coverage (IIS).”
A CDC spotlight article released on January 19, 2024, provides more information on flu vaccination coverage among children, adults and pregnant people. The latest flu vaccination data and information is available from the FluVaxView Weekly Flu Vaccination Dashboard.